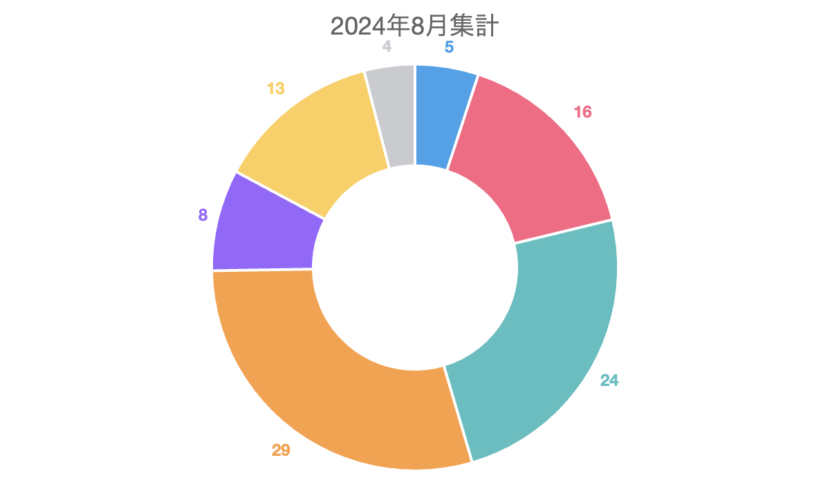
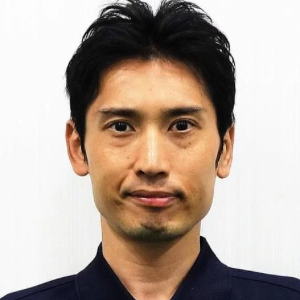
コンフィデンスについて 会員様の状況②(世代) 2024.08.13 2025.04.04 Post Share RSS Pin it 記事のタイトルとURLをコピーする 杉本 仁太郎 コンフィデンス代表の杉本仁太郎です。当ジムは健康と美容向けのパーソナルトレーニングを中心に、男女問わず、幅広い世代の方にご利用頂けるクラブです。岐阜で身体作りのチャレンジをお考えの方は、ぜひ私たちにお任せ下さい。 https://confidence77.com/ Instagram X Post Share RSS Pin it 会員様の状況①(性別) 次の記事





.png "PERSONAL-GYM コンフィデンス")
.png?1752043373 "PERSONAL-GYM コンフィデンス")
.png "PERSONAL-GYM コンフィデンス")






コメント